Special Report Korea’s Shipbuilding Industry’s Mid-to Long-term Outlook and Policy Ta…
페이지 정보
작성자 최고관리자 댓글 0건 조회 4,151회 작성일 20-06-11 16:48본문
1. Oil Tanker, Container Ship, and Bulk Carrier Market’s Mid- to Long-term Outlook
(1) Oil Tanker Market’s Mid- to Long-term Outlook
1) Goods Transport Forecast
In the oil tanker market outlook’s oil transport forecast, the global oil production volume and production relative to transport volume trends are incorporated into the forecast. Crude oil transport volume was higher than production volumes in the mid-2000s. However, it has since continued to fall. The changing trend translates into an increase in petroleum product transport volume. Following the Global Financial Crisis(GFC), global crude oil transport volume continuously fell. In contrast, petroleum product transport volume continued to rise from both a bearish global economy and an increase in investments by the United States(U.S.) and Middle Eastern oil states towards oil refineries and petrochemical facilities. It is assumed that this trend will continue for the next ten years. However, over the following five years, MSI expects expansions to oil refineries in Asia and the Middle East.
The main assumptions for long-term forecasting until 2030 are made from the following index. Transport volume up until 2023 incorporates the growth rate of crude oil production and demand from MSI’s forecasts made in a special report for the Korea Ocean Business Corporation. Post-2024 global oil production forecasts utilise BP’s figures as BP annually releases linearly interpolated five-yearly oil production forecasts. It is still assumed that relative to oil production, crude oil transport volumes will continuously fall, while petroleum product transport volumes rise in its place. It is also expected that investments will be completed in Asia and the Middle East by 2H 2020 with moderate increases until 2030. WTI made forecasts using IHS Markit’s August 2019 figures and ship disposal values which reflects an active market in the Mid-Western U.S. LIBOR based on a base-case scenario interest rate of 2.1%.
2) Reserve Fleet Efficiency Outlook
The oil tanker market’s transport volume to ship carry capacity is continuing downwards from its highs in 2004. From the mid-2000s, single body hulled oil tanker output started to increase rapidly. As such, with the global economy growing and transport volume rising, ship carrying capacity could not keep up with demand. However, just before the GFC, transport volume growth began to contract and, in turn, transport volume relative to ship carrying capacity began to fall. Following the GFC, to save fuel costs from the rising cost of oil and in preparation for strengthened environmental standards, crude oil tankers began to their sailing speeds. In 2020, with the implementation of Sulphur Oxide(SOx) emissions regulations and strengthened Energy Efficiency Design Index(EEDI) standards, the slow sailing trend will continue.
3) Order Obtention–Construction Model and Ship Disposal Model Applied
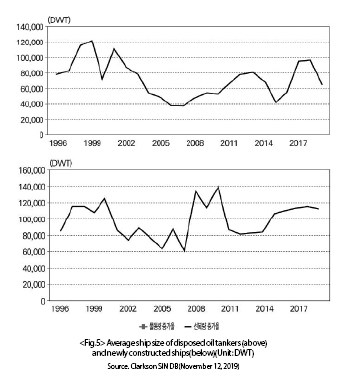
Assumptions are made with regards to the average size of new ships and disposed ships to model order obtention-construction and ship disposal rates. The average disposed ship size decreased significantly with most ultra-large oil tankers built in the 1970s already disposed of in the 1990s. However, given current market conditions, the average disposed ship size is changing drastically. On the one hand, newly constructed ship sizes differ depending on sectoral conditions, but the general shipbuilding industry seems reluctant to undertake large-scale projects. The average disposed ship size fluctuates periodically, as such, a ten-year average is taken. New ship sizes are smaller but are steadily grown according to trends.

4) Impact of External Factors Such as Technological Development and Environmental Protection Regulations
The effects of environmental protection regulations are considered. In 2017, the compulsory installation of the Ballast Waste Management System(BWMS); in 2020, the Sulphur Oxide emission regulation; in 2022, the implementation of EEDI’s “phase three”; and in 2025, the implementation of EEDI’s “fourth phase” are incorporated into forecasts. As such, more ships are expected to be constructed to replace disposed ships arising due to the environmental regulations and market fluctuations.
Environmental regulations and technological development implementation are expected from 2020 to 2030. As a result, increased demand from positive investor sentiment is taken into account. Additional demand has also been taken into consideration upon conducting several interviews in which experts believed demand would recover in 2020 before the implementation of EEDI’s various phases and rise again in the 2030s with further strengthened regulations. Lastly, the average residual ship quantity demanded is given as a ratio of DWT: Compensated Gross Tonnage(CGT) with all figures given in CGT.
5) Forecast outcome
The expected long-term oil tanker construction growth figures are as follows: 7.1 million CGT from 2014 – 2018, 7.7 million CGT from 2019 – 2024, 8.6 million CGT from 2025 – 2030. The growth trend mainly accounts for strengthened environmental regulations.
(2) Mid-to long-term container ship outlook
Outlook for the container ship market is formulated based on the same assumptions as the oil tanker market. However, transport volume is based on handling capacity. Container transport volume shares high correlations with the global economic growth rate with a 91.1% correlation between 1997 and 2018. The container transport volume forecast incorporates trends provided IHS Markit’s global economic growth rate table published in September 2019.
The container transport volume grew exponentially during the 2000s in line with an expanding global economy. Even after 2007, shipping capacity continued to grow faster than transport volume. Following the GFC, global shipping companies began to feel the impacts of the slowing global economy; however, the extent of shipping capacity contraction was limited to a slight fall in 2010. The ‘Chicken game’ between shipping companies and larger container ships continued until 2016, leading to an oversaturated market supply.
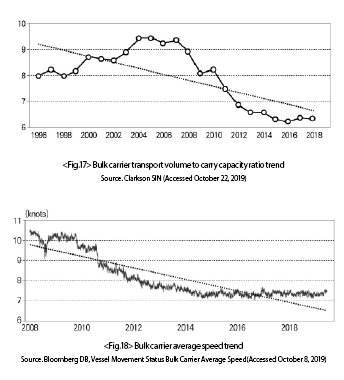
Following the GFC, shipping companies attempted to overcome the economic downturn by utilising surplus ships and operating ships at low speeds to reduce fuel costs. As a result, from 2009 onwards, carrying capacity relative to transport volumes fell, and has since maintained that trend. As aforementioned, average ship speeds began to fall from 2008 but dropped significantly between 2010 and 2012. Compared to 2008’s average speed, speeds fell more than 25% from 2015. As of 2019, the average ship speed was down 29% from 2008 levels.
The average disposed container ship size and newly constructed container ship size is also considered. The average ship size differs between years from growing ship sizes and mass construction taken on by shipping companies. In line with the trend of increasing ship sizes, the size of disposed ships also grew. However, according to industry professionals, the growing ship size trend for new ships is expected to cease for the next ten years. This is because, despite reorganisation of ports based around 20,000 Twenty-foot Equivalent Unit(TEU)-class ships, the outcome of investment (to ports and ships) have not been satisfactory. Also, following the confirmed expansion of the Panama Canal, the ultra-large ship market and the mid- to large-ship markets are experiencing polarising effects.
The impacts of environmental regulations, as applied to oil tankers, is applied to container ships. Also, the effects changes to demand volume from key industry-affecting events is applied after conducting interviews with industry professionals. Demand volume was estimated in TEU but is converted to a TEU to CGT ratio for this study. With the onset of ever-growing container ship sizes, the TEU to CGT ratio is growing. However, adjustments are made to normalise the effects of polarisation of ship construction. Upon accounting and adjusting for the variables, the following average construction volume is forecasted: 6.5 million CGT from 2014 – 2018, 6.7 million CGT from 2019 – 2024, and 8.2 million from 2025 – 2030.
(3) Mid-to Long-term Forecast for Bulk Carriers
Forecasting methodology for bulk carriers is the same as that of oil tankers and container ships. However, considering the diverse nature of items transported by bulk carriers, it was difficult to formulate exact forecasts. According to Clarkson, in 2008, total bulk carrier transport volume was 5.2 billion tons of which 1.4 billion tons(28.3%) was for iron ore, 1.26 billion tons(24.2%) was for coal – 996 million tons(19.1%) was for bunker coal, and 267 million tons (5.1%) was for coke-making coal, and 473 million tons(9.1%) was for grains – 3.26 billion tons(6.2%) was for wheat, and other grains and 1.47 billion tons(2.8%) was for soybeans.
In addition, steel products 390 million tons(7.5%), timber 378 million tons(7.2%), fertiliser 176 million tons(3.4%), agricultural products 168 million tons(3.2%), cement 134 million tons(2.6%), and bauxite 116 million tons(2.2%). Items making up for less than 2% of transport volume are scrap, petroleum coke, sugar, nickel ore, salt, manganese ore, anthracite, aluminium and other cokes. Bulk carrier transport volume shares a significant correlation with the global economic growth rate, with a 78.1% correlation from 1997 to 2018. During the 2000s China economy began to develop rapidly, and despite the GFC, China’s steel industry also grew, increasing bulk carrier transport volumes. However, recent contractions to the global economy have compressed steel demand and, in turn, weakened bulk carrier transport volumes.
According to the World Steel Association(WSA), global steel demand grew an average of 6.4% YoY between 2000 and 2008 but fell to 3.4% YoY between 2009 and 2018. Furthermore, WSA forecasts a 0.9% YoY growth rate between 2019 and 2025 and a 0.7% YoY growth from 2026 to 2030. Also, BP forecasts a gradual fall in global demand for coal from 2020 to 2030. The OECD-FAO Agricultural Outlook(2019) forecasts a 1.4- 1.5% YoY demand growth rate from 2022 to 2028 for agricultural goods such as wheat, corn, soy, rice and other grains. This report will use MSI’s bulk transported volume for forecasts until 2023 and apply WSA’s, BP’s and OECD-FAO’s forecasts as well as the global economic growth rate for forecasts beginning 2024. For years with available bulk transport volume forecasts, the corresponding data will be used, and for years without available data, global economic growth patterns will be assumed.
Except for the period immediately following the GFC, Bulk transport volumes have been relatively satisfactory. However, the carry volume growth rate was increasing rapidly. Despite developments, beginning 2015, transport volume and carry volume growth rates have started to slow down.
Upon comparing bulk carrier transport volumes with carrying capacity, it was observed that until 2010 transport volumes were relatively high, but volume began to fall with the growth of carrying capacity. And the downward trend has continued until today. Bulk carrier average speeds started to fall in 2011 with the fall in transport volume relative to carrying capacity. The shipping market saw its worst year in 2016 with a 26% transport volume drop from 2008 levels. Even today, improvements are yet to be made.

The average size of disposed bulk carriers and new bulk carriers is considered based on previous data. China’s economic growth and steel industry’s expansion has continuously contributed to the growing size of bulk carriers, especially ultra-large bulk carriers such as the Valemax and the Chinamax.
The impact of environmental regulations on oil tankers and container ships is also considered for bulk carriers. Demand, like oil tankers, is estimated in DWT, and the DWT to CGT ratio is considered and estimated in CGT.
The DWT to CGT ratio is continuously growing from the increasing size of bulk carriers, thus is incorporated into the study. Bulk carrier average construction volume from 2014 – 2018 was 10 million CGT, expected average construction volume from 2019–2024 is 6.4 million CGT, and the expected average construction volume from 2025–2030 is 5.6 million CGT.
※ Will continue next month.
- 이전글Northern Lights show the way to seaborne CCS solutions 20.06.11
- 다음글보쉬렉스로스(Bosch Rexroth), 인트라로지스틱스를 위한 콤팩트-자동화 구현 20.05.14


